Troubleshooting OpenStack Neutron Networking, Part One
9 March, 2015There’s a bit of gap in the current crop of OpenStack documentation, both official and unofficial, when it comes to doing any kind of end-to-end operational troubleshooting on the networking side of things. This series of posts is an attempt to rectify that and join a few concepts together in a way that other administrators will find useful (I hope!).
Our installation mirrors the recommended architecture involving Neutron + ML2 + Open vSwitch and GRE tunnels so these notes only really apply to that combination. You’re on your own with anything else ;)
In the example below, ‘acid’ is a compute node, ‘deadline’ is my laptop, and ‘osnet1’ is a network node.
DHCP
Information gathering
Pretty much every guide suggests this because it’s solid advice: A good place to start is to get a few key pieces of information noted down in one place somewhere, as you’ll be referring to these multiple times over the course of this exercise.
Instance name, UUID, location (hypervisor), MAC address
Get the UUID of your instance either via Horizon or by doing the following:
(openstack)nick@deadline:~> nova list --all_tenants | grep void
| d54a6557-e114-4e26-98b8-55c814fb938a | void | ACTIVE  | - | Running | default=192.168.0.2, 85.199.252.173
nova show $UUID will tell you which Hypervisor this instance is currently on. Look for the OS-EXT-SRV-ATTR:hypervisor_hostname property, but note that this attribute is only returned if you’re an admin.
Network name, UUID, segmentation ID
You can use Horizon to get the network UUID or use neutron net-list and filter by network name. Once you’ve got the UUID, you can find out the segmentation_id by doing the following:
(openstack)nick@deadline:~> neutron net-show -F provider:segmentation_id 4dc325ed-f141-41d9-8d0a-4f513defacad
+--------------------------+-------+
| Field | Value |
+--------------------------+-------+
| provider:segmentation_id | 11 |
+--------------------------+-------+
At this point you should convert that segmentation_id into hexadecimal as that’s how it’s referred to in OpenFlow, so in this case 11 = 0xb. What do we need this for? All will soon be revealed!
Subnet name, UUID
Responsible network node for DHCP and L3
You can obtain this now that you’ve got the network’s UUID by doing the following:
(openstack)nick@deadline:~> neutron dhcp-agent-list-hosting-net 5f1e4cc8-37e2-4bfb-b96f-ea1884121542
+--------------------------------------+--------+----------------+-------+
| id                                   | host   | admin_state_up | alive |
+--------------------------------------+--------+----------------+-------+
| 1beb99ef-e6f6-4083-8fb6-661f2f61c565 | osnet1 | True           | :-)   |
+--------------------------------------+--------+----------------+-------+
If it lists more than one agent then lucky you - you now have more than one place to look ;)
Examining the basics
Your first step should be to examine the basics and look for anything obvious that might be awry. It’s amazing how often the simple problems are overlooked and how quickly some people seem to want to dive into the more esoteric aspects of the system.
-
Look on the compute node and the network node to make sure they’ve got an interface in the right network and that it’s got an IP address. Can you ping one from the other?
-
On your compute node, check to see that there’s the necessary Open vSwitch bridges in place - br-int and br-tun if you’ve followed the official installation guides - and that there’s some GRE tunnels established between the virtual switches. Are those tunnels on the right subnet? Do the IP addresses look familiar?
-
If you haven’t already, now might be a good time take a look at the logs for nova-compute, neutron-server, neutron-plugin-openvswitch-agent, and OVS.
-
Make sure there’s a DHCP agent responsible somewhere for this network - see the 3rd point above;
-
Check on the relevant network node for a corresponding network namespace and running dnsmasq instance.
Use ovs-vsctl to take a look at the virtual switches that are defined and to check established GRE tunnels:
root@acid:~# ovs-vsctl show
aa3447b4-a88a-459a-bdae-5c4f04a67632
Bridge br-tun
Port "gre-0a0aaa92"
Interface "gre-0a0aaa92"
type: gre
options: {in_key=flow, local_ip="10.10.170.133", out_key=flow, remote_ip="10.10.170.146"}
[…]
Similarly, looking taking a quick look on the network node at the relevant network namespace can sometimes give you an obvious clue to work on:
nick@osnet1:~$ sudo ip netns list | grep 5f1e4cc8-37e2-4bfb-b96f-ea1884121542
qdhcp-5f1e4cc8-37e2-4bfb-b96f-ea1884121542
nick@osnet1:~$ ps auxww | grep [5]f1e4cc8-37e2-4bfb-b96f-ea1884121542
nobody   11651  0.0  0.0  28204  1092 ?        S    Nov27   0:00 dnsmasq --no-hosts --no-resolv --strict-order --bind-interfaces --interface=tapb7c643d7-1c --except-interface=lo --pid-file=/var/lib/neutron/dhcp/5f1e4cc8-37e2-4bfb-b96f-ea1884121542/pid --dhcp-hostsfile=/var/lib/neutron/dhcp/5f1e4cc8-37e2-4bfb-b96f-ea1884121542/host --addn-hosts=/var/lib/neutron/dhcp/5f1e4cc8-37e2-4bfb-b96f-ea1884121542/addn_hosts --dhcp-optsfile=/var/lib/neutron/dhcp/5f1e4cc8-37e2-4bfb-b96f-ea1884121542/opts --leasefile-ro --dhcp-range=set:tag0,192.168.0.0,static,86400s --dhcp-lease-max=256 --conf-file= --domain=datacentred.io
But if you’ve double-checked and exhausted the basics above and you can’t see anything amiss, it’s time to brew a fresh pot of coffee and roll up your sleeves.
Dude where’s my DHCPDISCOVER
At this point we need to start digging to find out exactly where our traffic is (or isn’t) going. As you’ve already got a session open on the responsible network node, probably the easiest place to look first is within the relevant qdhcp network namespace. Use tcpdump to look for DHCPDISCOVER messages arriving here:
root@osnet1:~# ip netns exec qdhcp-5f1e4cc8-37e2-4bfb-b96f-ea1884121542 tcpdump port 67 or port 68 -lne
tcpdump: verbose output suppressed, use -v or -vv for full protocol decode
listening on tapb7c643d7-1c, link-type EN10MB (Ethernet), capture size 65535 bytes
11:18:27.112022 fa:16:3e:34:a3:5c > fa:16:3e:54:77:5b, ethertype IPv4 (0x0800), length 301: 192.168.0.10.68 > 192.168.0.3.67: BOOTP/DHCP, Request from fa:16:3e:34:a3:5c, length 259
11:18:33.009733 fa:16:3e:34:a3:5c > ff:ff:ff:ff:ff:ff, ethertype IPv4 (0x0800), length 333: 0.0.0.0.68 > 255.255.255.255.67: BOOTP/DHCP, Request from fa:16:3e:34:a3:5c, length 291
11:18:33.009915 fa:16:3e:54:77:5b > fa:16:3e:34:a3:5c, ethertype IPv4 (0x0800), length 354: 192.168.0.3.67 > 192.168.0.10.68: BOOTP/DHCP, Reply, length 312
11:18:33.011455 fa:16:3e:34:a3:5c > ff:ff:ff:ff:ff:ff, ethertype IPv4 (0x0800), length 345: 0.0.0.0.68 > 255.255.255.255.67: BOOTP/DHCP, Request from fa:16:3e:34:a3:5c, length 303
11:18:33.011631 fa:16:3e:54:77:5b > fa:16:3e:34:a3:5c, ethertype IPv4 (0x0800), length 373: 192.168.0.3.67 > 192.168.0.10.68: BOOTP/DHCP, Reply, length 331
The above shows what it looks like when everything’s working as it should. Lucky me, right? You can also use strace against that dnsmasq’s PID to find out what’s going wrong within the process if you’re that way inclined
If you don’t see traffic reaching this network namespace then the problem lies elsewhere in the chain. 9 times out of 10 you’re OK at this point, and it’s here really that the lack of documentation might get in the way of making further progress.
Let’s make sure DHCP traffic is making its way out of our compute node as it should do.
On the Compute Node
Backing up a little, it’s worth refreshing our memories on how this is supposed to hang together. Each instance’s network interface is realised as a TAP interface on the hypervisor. These TAP interfaces are bridged (using Linux bridges) into an Open vSwitch bridge, and it’s here that most of the magic happens. But why is there a Linux bridge in the mix? This is actually where Security Groups are realised - the official explanation is: “Ideally, the TAP device vnet0 would be connected directly to the integration bridge, br-int. Unfortunately, this isn’t possible because of how OpenStack security groups are currently implemented. OpenStack uses iptables rules on the TAP devices such as vnet0 to implement security groups, and Open vSwitch is not compatible with iptables rules that are applied directly on TAP devices that are connected to an Open vSwitch port.”
So let’s check to see if there’s some sensible iptables rules in place for our instance’s TAP interface. To find out which TAP interface we should be examining, you can either look at the process table or check the VM’s configuration file - libvirt.xml - which exists in a folder with the same name as its UUID under /var/lib/nova/instances:
root@acid:/var/lib/nova/instances/2c9a0a61-ccf0-4f26-baa0-c9b16d72b645# grep -i tap libvirt.xml
	<target dev="tap9c4a0ea7-ba"/>
We can use the ‘9c4a0ea7’ in this example’s to double check the iptables rules that are in place. You’re looking for something like:
root@acid:~# iptables -S | grep 9c4a0ea7
[...]
-A neutron-openvswi-o9c4a0ea7-b -p udp -m udp --sport 68 --dport 67 -j RETURN
-A neutron-openvswi-o9c4a0ea7-b -p udp -m udp --sport 67 --dport 68 -j DROP
[…]
If that looks OK then it’s time to dig a little deeper. Be warned: You’re almost certainly going to need more coffee.
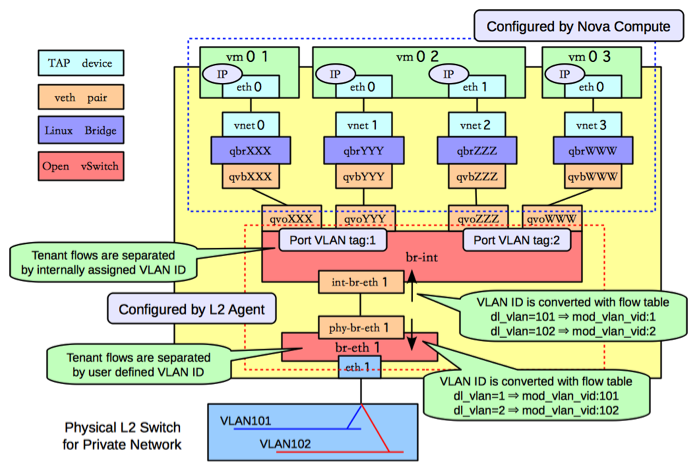
Remember that each instance’s network interface corresponds with a TAP device on the hypervisor, and that this is connected into a Linux bridge and then from there into an OVS bridge called ‘br-int’. You can use brctl show to show which interfaces are associated with which bridge:
root@acid:~# brctl show
bridge name	bridge id		STP enabled	interfaces
qbr2b57faaf-8d		8000.0e83816f2e37	no		qvb2b57faaf-8d
							tap2b57faaf-8d
qbr3c726ea9-34		8000.9a7f311e7773	no		qvb3c726ea9-34
qbr529df2ab-78		8000.ea0665357633	no		qvb529df2ab-78
							tap529df2ab-78
qbr9a356881-4f		8000.8a401b915524	no		qvb9a356881-4f
qbr9c4a0ea7-ba		8000.3ae5d1c542a1	no		qvb9c4a0ea7-ba
							tap9c4a0ea7-ba
qbre1041f6d-9e		8000.b690266a1a3c	no		qvbe1041f6d-9e
qbrec9191c7-60		8000.5278b133888e	no		qvbec9191c7-60
							tapec9191c7-60
(virbr0 can be disregarded - this is created as part of the installation of QEMU and KVM and isn’t used by OpenStack).
Sticking with the ‘9c4a0ea7’ part of our interface’s ID used above, we can check to make sure that there’s the relevant port:
root@acid:~# ovs-vsctl show
aa3447b4-a88a-459a-bdae-5c4f04a67632
[…]
	Bridge br-int
		fail_mode: secure
[…]
	Port "qvo9c4a0ea7-ba"
		tag: 104
		Interface "qvo9c4a0ea7-ba"
[…]
Output snipped for brevity. Key details here are a) we have the interface on bridge br-int that we’d expect and b) tag that’s associated with that port.
If any of these components are missing you’ll need to check through nova-compute’s logs in /var/log/nova and also the OVS agent’s logs under /var/log/neutron, both on the compute node in question. Something will have impeded the creation of these components and the logfiles should give you a pretty clear idea as to what. If not, try bumping up the logging and debug levels and then restarting the responsible agents to see where that gets you.
Open vSwitch and OpenFlow
Still not worked out what’s wrong? Poor you - this is where it gets messy. Let’s examine is how a packet traverses Open vSwitch and makes its way to a given network node. We’ve seen above how an instance’s network interface is connected into br-int. br-int is connected to br-tun via a patch:
root@acid:~# ovs-vsctl show
aa3447b4-a88a-459a-bdae-5c4f04a67632
	Bridge br-tun
[…]
		Port patch-int
			Interface patch-int
				type: patch
				options: {peer=patch-tun}
[…]
	Bridge br-int
		fail_mode: secure
[…]
		Port patch-tun
			Interface patch-tun
           		type: patch
				options: {peer=patch-int}
All traffic from br-int makes its way into br-tun via this patch. To look at the OpenFlow rules in place, use ovs-ofctl dump-flows br-tun:
root@acid:~# ovs-ofctl dump-flows br-tun
NXST_FLOW reply (xid=0x4):

[…]
Whoah, that’s a lot of output - so let’s try and break it down. The rules are grouped by tables, with packets modified and various options set before being sent off to another table or to a port. The high-level flow is basically this:
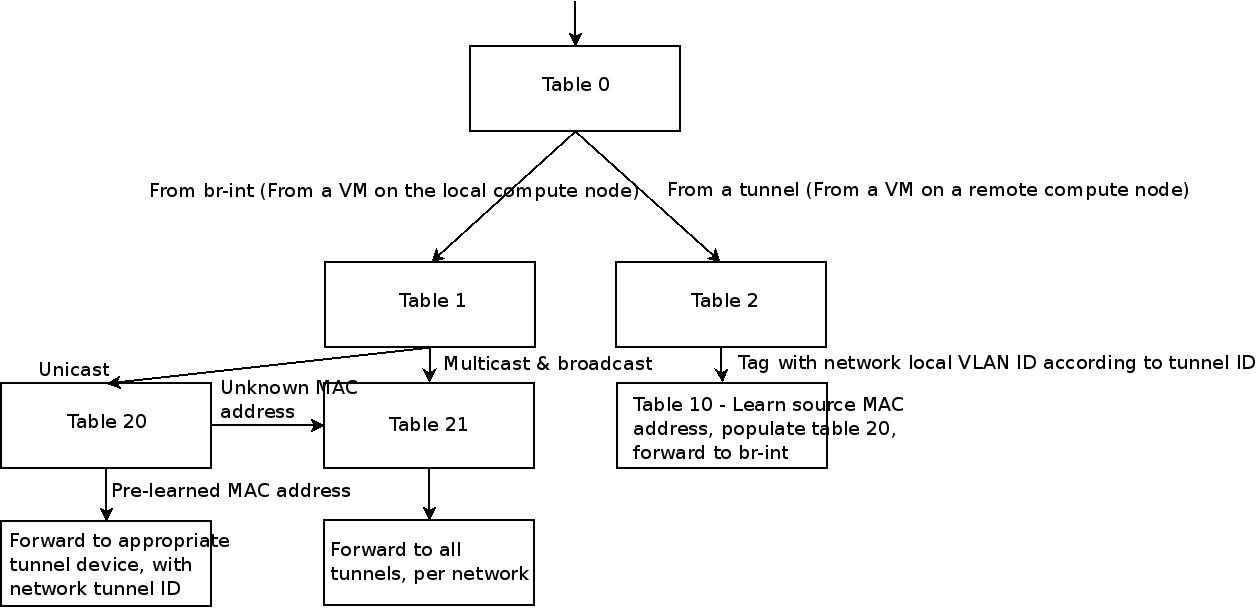
Thanks to Assaf Muller for this diagram. Really what you’re looking for here is rules in tables that correspond with the segmentation_id (translated into hex, remember!) and a vlan_tag which is internally assigned by OVS but corresponds with the tag associated with a given port.
If look at what happens with our network’s segmentation_id (27, or 0x1b):
root@acid:~# ovs-ofctl dump-flows br-tun | grep 0x1b
cookie=0x0, duration=941713.195s, table=2, n_packets=21465888, n_bytes=30396202891, idle_age=5, hard_age=65534, priority=1,tun_id=0x1b actions=mod_vlan_vid:104,resubmit(,10)
cookie=0x0, duration=941706.726s, table=20, n_packets=13688285, n_bytes=2686393985, hard_timeout=300, idle_age=2, hard_age=5, priority=1,vlan_tci=0x0068/0x0fff,dl_dst=fa:16:3e:52:c7:34 actions=load:0->NXM_OF_VLAN_TCI[],load:0x1b->NXM_NX_TUN_ID[],output:3
cookie=0x0, duration=941713.249s, table=21, n_packets=370, n_bytes=54414, idle_age=11432, hard_age=65534, dl_vlan=104 actions=strip_vlan,set_tunnel:0x1b,output:2,output:5,output:4,output:3,output:10,output:11,output:12,output:20,output:13,output:19,output:23,output:22,output:21,output:14,output:6,output:16,output:17,output:8,output:15,output:7,output:9,output:18
That corresponds with what we’d expect to see. For completeness, table 10 looks like:
root@acid:~# ovs-ofctl dump-flows br-tun table=10
NXST_FLOW reply (xid=0x4):
cookie=0x0, duration=2753753.313s, table=10, n_packets=22800331, n_bytes=31425726409, idle_age=2, hard_age=65534, priority=1 actions=learn(table=20,hard_timeout=300,priority=1,NXM_OF_VLAN_TCI[0..11],NXM_OF_ETH_DST[]=NXM_OF_ETH_SRC[],load:0->NXM_OF_VLAN_TCI[],load:NXM_NX_TUN_ID[]->NXM_NX_TUN_ID[],output:NXM_OF_IN_PORT[]),output:1
In this example everything’s as expected. We can use tcpdump on the relevant physical interface to see if all of this lines up and DHCP requests make it out of our hypervisor. You’ll need to just grep for DHCP and / or the instance’s MAC address as our traffic should be GRE encapsulated at this point:
root@acid:~# tcpdump -enl -i p1p1 | grep -i dhcp
tcpdump: verbose output suppressed, use -v or -vv for full protocol decode
listening on p1p1, link-type EN10MB (Ethernet), capture size 65535 bytes
15:06:41.750735 00:1b:21:6e:cc:a4 > 00:1b:21:6e:ce:7c, ethertype IPv4 (0x0800), length 374: 10.10.170.133 > 10.10.170.119: GREv0, key=0x7, proto TEB (0x6558), length 340: fa:16:3e:d6:12:52 > ff:ff:ff:ff:ff:ff, ethertype IPv4 (0x0800), length 332: 0.0.0.0.68 > 255.255.255.255.67: BOOTP/DHCP, Request from fa:16:3e:d6:12:52, length 290
Still with me? Now that we’re happy traffic is making it from the compute node, let’s take a look at what happens on the network node.
Network Node
As you’d expect, the configuration of the various Open vSwitch bridges and internals largely mirrors that of what’s on the compute except in reverse.
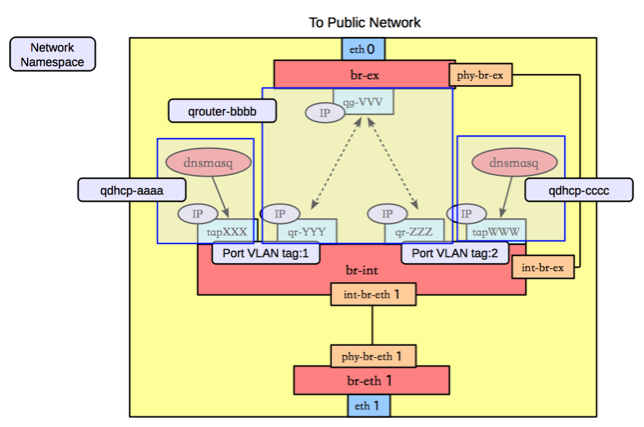
We know that our dnsmasq instance is running in a network namespace specific to our network’s UUID, how do packets end up there exactly? The network namespace also has a TAP interface:
root@osnet0:~# ip netns exec qdhcp-cfc5510c-6dda-4862-b63c-d16c7f52b521 ip li
1: lo: <LOOPBACK,UP,LOWER_UP> mtu 65536 qdisc noqueue state UNKNOWN mode DEFAULT group default
	link/loopback 00:00:00:00:00:00 brd 00:00:00:00:00:00
188: tap90752968-96: <BROADCAST,UP,LOWER_UP> mtu 1500 qdisc noqueue state UNKNOWN mode DEFAULT group default
	link/ether fa:16:3e:4e:79:57 brd ff:ff:ff:ff:ff:ff
Which will be connected to a port on br-int and have an associated tag:
root@osnet0:~# ovs-vsctl show | grep -A1 tap90752968-96
	Port "tap90752968-96"
   		tag: 22
       		Interface "tap90752968-96"
           		type: internal
Now if we look at the OpenFlow flows with these two bits of context - our internal tag and also the segmentation_id - it should start to make a bit more sense. The first table to examine is 2:
root@osnet0:~# ovs-ofctl dump-flows br-tun table=2 | grep 0x1b
cookie=0x0, duration=421236.766s, table=2, n_packets=133943644, n_bytes=26674991756, idle_age=0, hard_age=65534, priority=1,tun_id=0x1b actions=mod_vlan_vid:22,resubmit(,10)
Here we see packets matching our tunnel ID being tagged with VLAN ID 22 and then resubmitted into tunnel 10, the ‘learning’ table. From there, as this is DHCP and therefore multicast, there should be something in table 21:
root@osnet0:~# ovs-ofctl dump-flows br-tun table=21 | grep 0x1b
cookie=0x0, duration=421352.327s, table=21, n_packets=924, n_bytes=44295, idle_age=14, hard_age=65534, dl_vlan=22 actions=strip_vlan,set_tunnel:0x1b,output:2,output:4,output:3,output:9,output:10,output:11,output:12,output:20,output:13,output:19,output:23,output:22,output:21,output:14,output:5,output:16,output:17,output:7,output:15,output:6,output:8,output:18
And there is. This removes the VLAN tag and outputs it to the other ports on that switch. You can actually see the port numbers and corresponding attached interfaces with ovs-dpctl show:
root@osnet0:~# ovs-dpctl show
system@ovs-system:
	lookups: hit:2979708493 missed:17652283 lost:0
	flows: 69
	port 0: ovs-system (internal)
	port 1: br-int (internal)
	port 2: br-ex (internal)
	port 3: em2
	port 4: br-tun (internal)
	port 5: tap30264f60-4a (internal)
[…]
Again, that’s a working example. Hopefully you’ve not made it this far without spotting something that’s broken and a clue somewhere as to what the fix should be.
If you find you’re missing rules, then one way to re-add them without having to recreate the whole network is to remove and then re-add the network from the responsible DHCP agent. You can do this as follows:
With your network’s UUID, obtain the relevant network agent’s UUID:
(openstack)nick@deadline:~> neutron dhcp-agent-list-hosting-net 4dc325ed-f141-41d9-8d0a-4f513defacad
+--------------------------------------+--------+----------------+-------+
| id                                   | host   | admin_state_up | alive |
+--------------------------------------+--------+----------------+-------+
| 1beb99ef-e6f6-4083-8fb6-661f2f61c565 | osnet1 | True           | :-)   |
+--------------------------------------+--------+----------------+-------+
Then remove and re-add that network:
(openstack)nick@deadline:~> neutron dhcp-agent-network-remove 1beb99ef-e6f6-4083-8fb6-661f2f61c565 4dc325ed-f141-41d9-8d0a-4f513defacad
Removed network 4dc325ed-f141-41d9-8d0a-4f513defacad from DHCP agent

(openstack)nick@deadline:~> neutron dhcp-agent-network-add 1beb99ef-e6f6-4083-8fb6-661f2f61c565 4dc325ed-f141-41d9-8d0a-4f513defacad
Added network 4dc325ed-f141-41d9-8d0a-4f513defacad to DHCP agent
And now check to see if the missing OpenFlow rules are in place.
Next up - L3!
References
http://assafmuller.com/2013/10/14/gre-tunnels-in-openstack-neutron/ http://keepingitclassless.net/2014/07/sdn-protocols-2-openflow-deep-dive/ http://ovs-demystify.tumblr.com https://ask.openstack.org/en/question/51184/neutron-gre-segmentation-id-unique/ http://docs.openstack.org/admin-guide-cloud/content/under_the_hood_openvswitch.html